
Vision Counts
Get instant counts without a six-figure permanent camera setup. Record the district on an iPhone, upload the video, and let AI count people, vehicles, and movement patterns.
Pedestrian countsVehicle countsOn demand
Pantheon helps place-management teams understand the lived and built experience of a corridor, engage the community, publish useful reporting, and tell the story of what makes the place work.
How is the place moving?
Get instant counts without a six-figure permanent camera setup. Record the district on an iPhone, upload the video, and let AI count people, vehicles, and movement patterns.
What is the essence of this place?

Build a ground-truth read of the district: what is there, what it feels like, and how the built environment supports or weakens place identity.
What retail and trade-area data do we need?

Bring in retail and trade-area datasets without chasing scattered vendors or one-off sources.
How do we hear from more people?

Run multilingual surveys that work for quick intercepts, business feedback, and longer community listening.
How can people test public-space ideas?

Run digital charrettes where people can test street, plaza, and public-realm ideas instead of only reacting to static boards.
How do event ideas become real?

Turn event and activation ideas into clear permit steps, required forms, and organizer next actions.
How do we keep public data close at hand?

Free tool
Ask for public data in plain English and get reusable files for reports, memos, dashboards, and AI workflows.
Where do public updates live?

Coming soon
A coming-soon web reporting layer for turning maps, numbers, and updates into a public hub that can keep changing after the PDF is done.
How do we draft from the same source material?

Turn research, notes, and public data into report drafts, proposal language, and reusable copy blocks.
What is the current story repeating or missing?

Audit websites, social content, PDFs, and campaigns to find repeated messages, missing themes, and positioning gaps.
Need visuals that feel local?

Use community-centered visuals that feel specific to the district instead of generic stock imagery.
How should the experience hold together?

Design the websites, report systems, campaign pages, dashboards, and touchpoints that hold the story together.
Free tools for BID teams
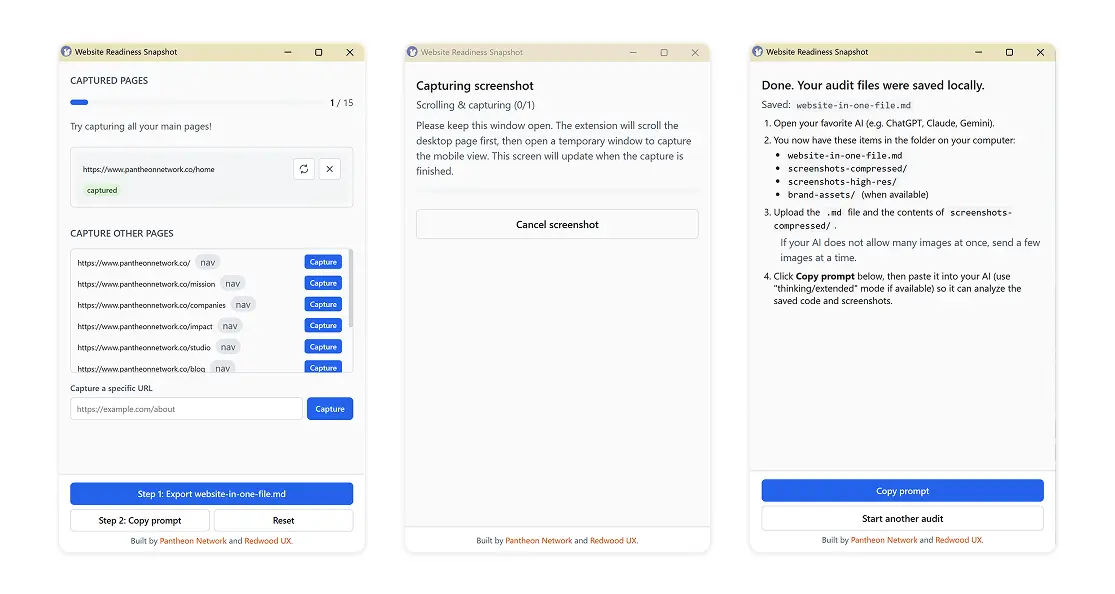
Website Readiness · Free tool
Website Readiness gives businesses a quick, practical check of whether their website is understandable to search engines, AI discovery tools, and customers. Use it as a lightweight member service inside a business engagement or digital readiness program.
Sancho Fetch · Free tool
Sancho Fetch is a free, open-source toolkit you drive from the AI tools you already use. Ask in plain English and it fetches real data from 120+ public sources — Census, World Bank, FRED, OECD and more — and saves it as files you can open. Useful in every sector, for any team that works with data.
Place-management product stack
Ground Conditions & Place Intelligence

Pedestrian, vehicle, and public-space counts that show how people actually move through the place.
Visit Vision CountsPlace intelligence that connects built conditions, lived experience, master-planning context, and organic place identity.
Visit City78
Retail mix, trade-area signals, market context, and data procurement for corridor and place strategy.
Visit Basil LabsEngagement & Member Support

Multilingual voice, text, and map-based input for businesses, residents, workers, visitors, and partners.
Visit Ella Surveys
Interactive public-realm planning for workshops, design conversations, and testing ideas with the community.
Visit Open Space Sandbox
A permitting workflow for activations, events, and public-space uses that help bring the place to life.
Visit OpenPlacesReporting & Public Data
Free tool: pull public datasets into reusable files for reports, context memos, appendices, and partner conversations.
Open Sancho FetchShareable web reports, indexes, dashboards, maps, and public pages that can keep evolving between formal reports.
Request NimbusResearch and writing workflows for turning data, notes, and priorities into reusable report, proposal, and outreach language.
Visit Pumpkin Pages & RoverlyMarketing & Communications

Community-centered, non-stock visuals for reports, campaigns, public updates, and place storytelling.
Visit 35mm.cloud
Websites, report systems, campaign pages, dashboards, and digital touchpoints for clearer place-management communication.
Visit Redwood UX
Audits websites, collateral, social content, and campaign materials to identify gaps, repetition, and stronger positioning.
What kind of request is this?
Tell us the project, team, and next step you have in mind.